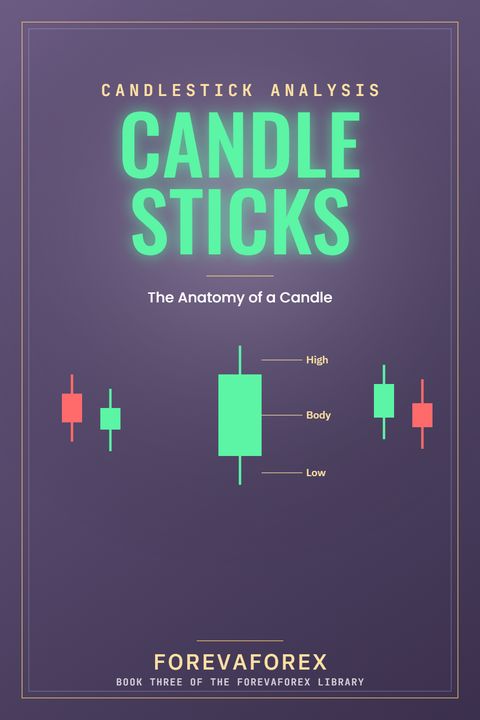
Candlesticks
The anatomy of a candle, from open, high, low and close through single, double and triple candle patterns, and how to read them in context.
Candles are the language of every chart. Knowing what a rejection, an engulfing or an indecision candle really says helps you time entries and avoid weak signals.
What is inside (24 lessons)
| 01 | The Building Blocks | 6 lessons |
| 02 | Single Candle Signals | 6 lessons |
| 03 | Multi-Candle Formations | 4 lessons |
| 04 | Reading Candles In The Real Market | 8 lessons |
Free sample lesson: The Anatomy of a Candlestick
A candlestick is the single most information dense object in all of technical analysis, a small, simple shape that manages to compress an entire battle between buyers and sellers, over a fixed stretch of time, into something you can read at a glance. Understanding it completely, not just recognizing its outline but genuinely understanding what every part of it represents, is the single most foundational skill this whole book is built on.
Every candlestick is made of exactly two parts. One, the body. Two, the wicks, also called shadows.
One: The Body
The body is the thick, rectangular part of the candle, representing the range between where price opened and where it closed during that candle's period. Its color tells you immediately which side won that fight, whether the candle closed higher than it opened or lower.
Two: The Wicks
The wicks, sometimes called shadows, are the thin lines extending above and below the body, marking the highest and lowest prices reached during that same period, even if price didn't stay there by the time the candle closed.
Together, these two parts capture four separate prices in one shape: the open, the high, the low, and the close, which is exactly why candlesticks replaced simpler line charts as the industry standard, they simply carry more usable information in the same amount of space. A single candlestick on a daily chart might represent an entire day of trading activity condensed into one shape, while that same candlestick on a five minute chart represents just five minutes, the shape's meaning always scales with whatever timeframe you're viewing.
Learning to read a candlestick fluently means training your eye to instantly separate these two components and ask what each one is telling you, rather than seeing the candle as one vague blob. That separation, body versus wick, is the doorway into every single lesson that follows in this book, starting with the four exact prices that build the body and wicks in the first place.
Keep reading Candlesticks
Illustrated books, live tools and a practice hub. Free to start.