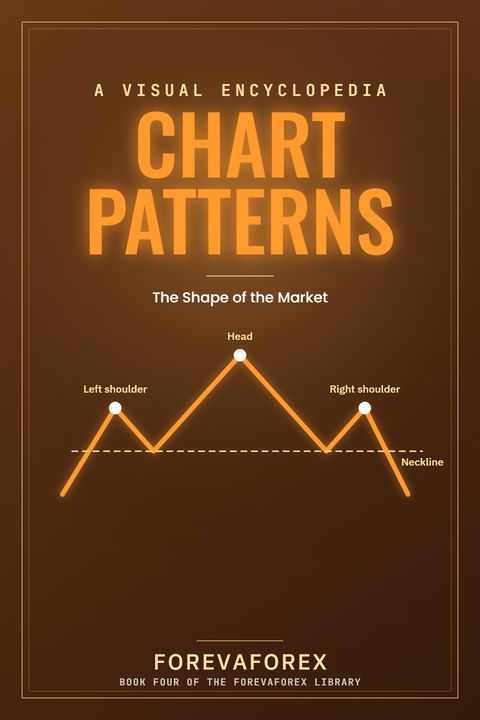
Chart Patterns
A visual encyclopedia of classical chart formations, from head and shoulders to flags and triangles, and how each one tends to develop.
Patterns give you ready made plans, with a clear entry, a logical stop and a target. You learn which ones deserve trust and which are noise.
What is inside (30 lessons)
| 01 | Foundations Of Patterns | 3 lessons |
| 02 | Reversal Patterns | 6 lessons |
| 03 | Triangles And Wedges | 7 lessons |
| 04 | Continuation Shapes And Bases | 6 lessons |
| 05 | Trading The Pattern | 8 lessons |
Free sample lesson: What Is a Chart Pattern?
A chart pattern is a recognizable shape that price draws on a chart as buyers and sellers push and pull against each other over time. Nobody designs these shapes and no one is trying to make price look like a triangle or a flag. The shapes appear on their own, as a by-product of real people making real decisions about where to buy, where to sell, and how long to wait, and because human behavior repeats, the shapes repeat too.
The most useful way to think about a pattern is as a picture of a negotiation. Every pattern shows two groups, buyers and sellers, arguing about what a fair price is, and the exact shape of the argument tells you who is currently winning, who is running out of energy, and roughly where the argument is likely to be settled. A pattern is not a magic symbol that predicts the future, it is a compressed summary of the recent balance of power.
Every classical pattern is built from the same small set of ingredients, and once you can see those ingredients, every pattern in this book will feel familiar rather than new. There are four worth knowing by name. One, a prior trend. Two, a series of swing highs and swing lows. Three, boundary lines that contain price. Four, a resolution, meaning the moment price finally leaves the shape.
One: A Prior Trend
A pattern is always read against what came before it. The same triangle means something different after a strong rally than it does after a long decline, because the pattern is really describing what the market does next to a move that already happened.
Two: Swing Highs And Swing Lows
Patterns are drawn by connecting the turning points of price, the peaks and troughs where one side gave way to the other. If you can mark swing points cleanly, you can find any pattern in this book.
Three: Boundary Lines
Most patterns are contained by two lines, an upper boundary connecting the highs and a lower boundary connecting the lows. The way those two lines relate to each other, parallel, converging, or sloped, is what gives each pattern its name and its personality.
Four: A Resolution
Every pattern eventually ends, and it ends when price breaks out of one of its boundaries. The pattern is only useful because of what it lets you anticipate before that break, and what it lets you confirm after it.
For example, a pair that has rallied strongly, then spends three weeks moving sideways between two clear price levels, is drawing a rectangle. The prior trend was up, the swing points cluster at two levels, the boundaries are flat and parallel, and the resolution is still to come. Naming the shape does not tell you which way it will break, but it tells you exactly what to watch and exactly where the argument gets settled.
A pattern is only a useful tool if you understand why it forms in the first place, because a shape you understand is a shape you can trust, and that is exactly what the next lesson explains.
Keep reading Chart Patterns
Illustrated books, live tools and a practice hub. Free to start.