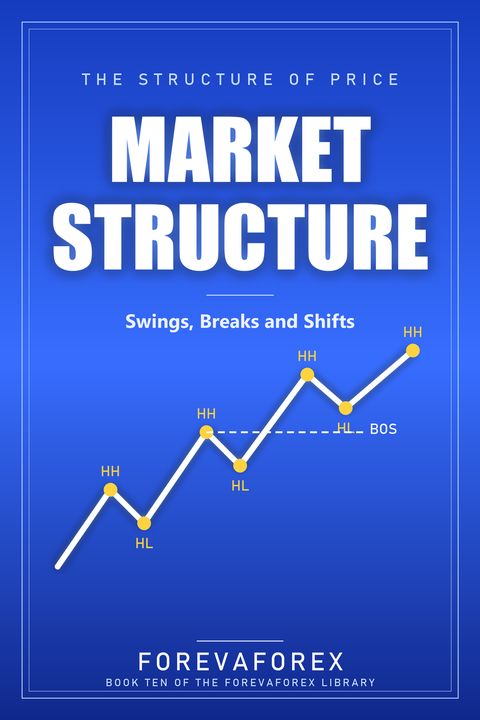
Market Structure
The skeleton of every chart: swing highs and lows, trends and ranges, breaks of structure, changes of character and how to build a structural bias.
Structure tells you which side is in control and where your idea is proven wrong. It gives you clean entries, sensible stops and a direction to prefer.
What is inside (16 lessons)
| 01 | Reading The Skeleton | 6 lessons |
| 02 | When Structure Changes | 5 lessons |
| 03 | Putting Structure To Work | 5 lessons |
Free sample lesson: What Is Market Structure?
Every chart you have ever looked at is made of the same simple pieces. Price moves up, stops, turns, moves down, stops, and turns again. Each of those turning points is a swing, and the pattern they form over time is called market structure. If you removed every indicator, every drawing, and every headline from your screen, the sequence of swings would still be there, telling you the story of who has been winning, buyers or sellers.
That is why structure is the first skill in this book. It does not predict anything. It describes what has already happened in a way you can read quickly and consistently, and that description gives you a direction to lean toward, a set of reference points to measure against, and a clear signal when the picture changes.
There are three points to hold onto. One, it is built from swings. Two, it defines direction. Three, it gives you reference points.
One: It Is Built From Swings
Each time price stops going one way and turns, it leaves behind a swing high or a swing low. Link those points in order and you get the shape of the market. A rising shape means buyers have been winning. A falling shape means sellers have. A flat shape means neither side has gained the upper hand yet. That shape is the structure.
Two: It Defines Direction
Instead of guessing whether a market is going up or down, you read the swings. If each high and each low is above the one before, the market is in an uptrend. If each is below the one before, it is in a downtrend. If price keeps turning back inside the same band, it is ranging. This gives you a direction based on evidence instead of on how you feel about the pair.
Three: It Gives You Reference Points
Swings are also the places where ideas are proven right or wrong. A buy idea is wrong if price falls below the last swing low that supported it. A target is reasonable if it sits near the last swing high where sellers appeared. Because swings are real turning points, they anchor your entries, your stops, and your targets to something the market itself created.
For example, a currency pair falls to a low, rallies to a high, pulls back to a low that is higher than the first, and then rallies to a new high above the previous one. You can see this without any indicator: two higher lows and two higher highs in order. That sequence tells you buyers have controlled the last several moves, and it hands you a line in the sand, the most recent higher low, which you would watch as the level that would prove the picture wrong.
A beginner often skips this step and goes straight to an indicator. An experienced trader looks at the swings first, because most indicators are built from the same prices and cannot tell you anything the structure does not already show.
Before you can read structure you have to mark swings the same way every time, which is the skill of the next lesson.
Keep reading Market Structure
Illustrated books, live tools and a practice hub. Free to start.